- A $10M B2B SaaS added $1.1M in ARR from organic and AI search in 8 months, November 2025 to June 2026.
- AI referrals made up 4.2% of organic sessions, booked 14.6% of demos, and drove 23% of the revenue, about $250K. That counts only provable AI-sourced buyers, so it reads as a minimum.
- The engine behind it: 50 buying prompts tracked across the engines, ~25 decision-stage pages built, 154 pages refreshed, 22 new G2 reviews, ~365 new linking sites.
- Total traffic fell the whole time, informational clicks that were never going to buy. Branded search still grew 28%, and qualified pipeline 86%.
| Engagement snapshot | |
|---|---|
| Client | B2B SaaS, ~$10M ARR (unnamed at the founder’s request) |
| Timeline | November 2025 to June 2026 |
| Scope | AI Search Optimization, SEO & Content, Review Management, Digital PR |
| Goal | Revenue from search, on surfaces where the category’s buyers now decide |
| Measured by | ARR, qualified pipeline, demos, AI share of voice. Traffic was never the goal. |
The situation in November: falling traffic, unwatched AI answers
When this engagement started in November, the picture was one we see all the time: a strong product, years of content behind it, and an organic channel doing decent work but slowly starting to decay. The decay had 2 drivers. Buyers are changing how they search, and paid ads plus AI Overviews now take up a far bigger share of the results page, which leaves informational content earning fewer clicks than it was built for.
The previous SEO work was built for exactly those informational queries, and AI Overviews had started answering them in place. When we asked the LLMs to compare vendors in this category, the brand struggled to show up. The company tracked rankings and traffic in detail, but the answers to the commercial and buying prompts, on the LLMs and on Google itself, sat in a channel nobody was watching.
The category wasn’t empty either: 2 competitors were already showing up well in AI search. We read that as good news. If they could get in, the answers could be moved, and a brand niched tightly to its ICP could take its piece of the pie. The whole engagement grew out of that missing column.
The plan: our revenue engine, 4 service lines
The 4 lines in scope were AI Search Optimization, SEO & Content, Review Management, and Digital PR. Social marketing wasn’t part of this engagement, so we’ll only claim credit for levers we pulled.
On paper those read as 4 separate services. In practice, and this is how we explain it to clients, we run them as a single engine, because the AI search results are what the other lines exist to feed.
We’ll say openly that probably 80% of the work is still traditional SEO and digital PR. The other 20% is what decides the AI answers, and it’s work SEO never asked for. We track the query fan-outs each engine runs behind a buyer’s question, and we map where the LLMs pull from inside Google’s index, so we know which pages and third-party sources feed the answers. Brand mentions carry more weight than they used to, and appearing in the listicles an engine searches matters far more now, because an AI that keeps meeting your name across those lists trusts you enough to name-drop you in its answers.
The process was the same one we run on every engagement: ICP mapping, then strategy, then the content and technical work, then authority building, all pointed at compounding pipeline and revenue.
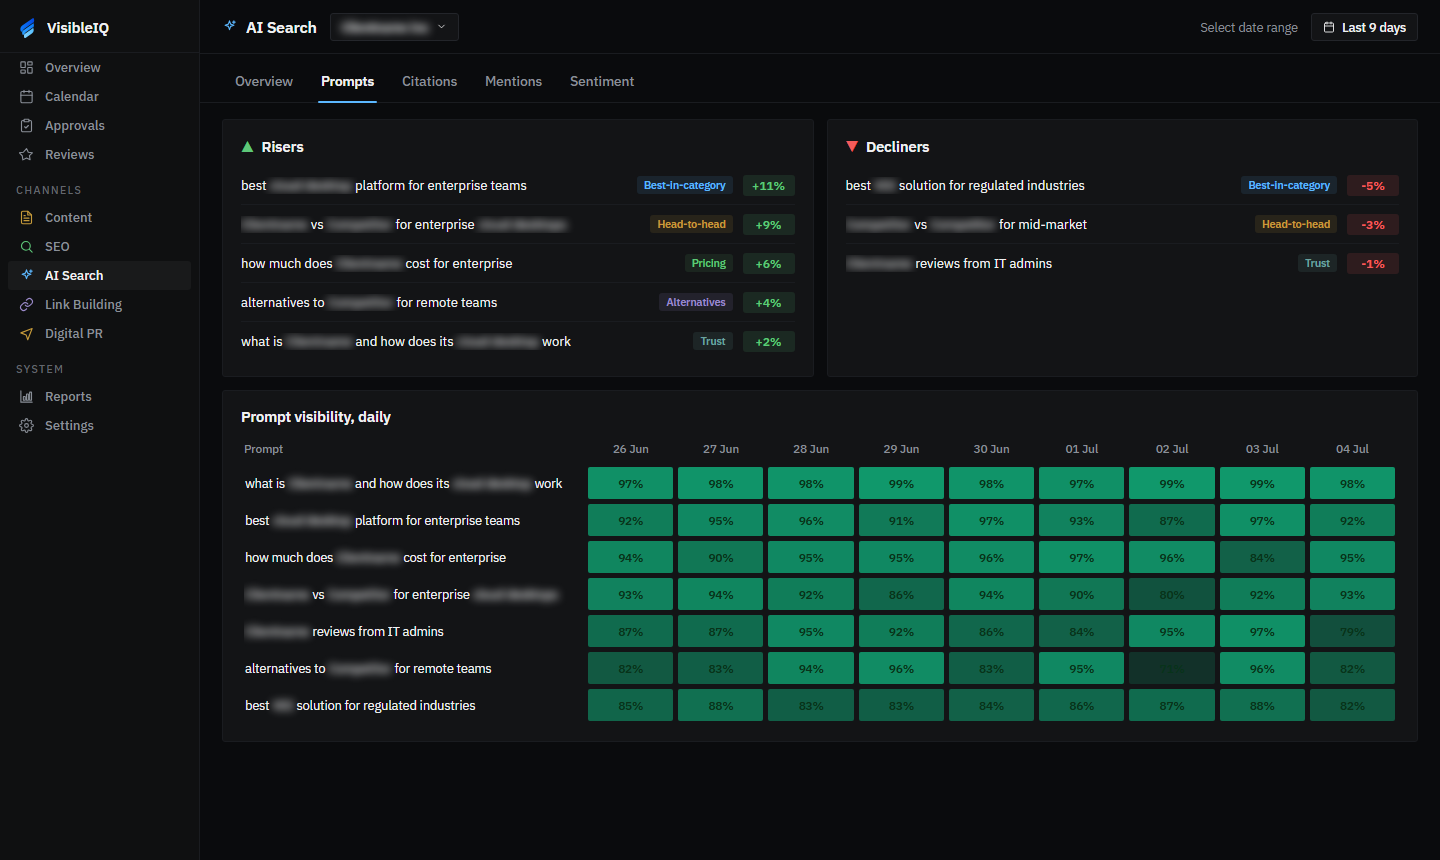
- ICP mapping: Who signs, who evaluates, and what they ask when nobody from sales is in the room: the pain points, phrased the way buyers type them. Produced the engagement’s key artifact: 50 non-branded buying prompts.
- Strategy: Weight the 4 service lines against where this category’s buyers decide, and set the measurements: predicted ARR, pipeline, demos, AI share of voice.
- Content and engineering: Commercial and decision-stage pages built for the 50 prompts, plus the technical and entity work that lets Google and the AI engines read the site and quote it comfortably.
- Authority building: Review velocity on the platforms this category lives on, picked by which review sites the LLMs cite, plus third-party coverage via link building, mentions and digital PR: the outside evidence AI engines look for.
- Compounding revenue: Double down on what works: prompts hold their positions, LLM recommendation rates climb, branded demand grows. Every month the same spend buys more pipeline.
ICP mapping produced the 50 prompts, the commercial and transactional questions buyers ask at the decision stage, phrased the way real customers phrase them on Google and in the LLMs. We pulled them from sales transcripts the client shared with us, so the wording came from buyers rather than a keyword tool. And we deliberately stopped at 50, against a site profile of 33,000 ranked keywords. That was the whole point: a tight profile, hyper-focused on the decision-stage prompts, because that’s where the money was and the prompts are where vendors get picked.
The mapping also told us why the brand had been struggling. Nearly all the previous SEO work was informational, the “what is” kind of post. It had brought traffic for years, and the traffic never turned into revenue. Spoiler alert, since we show it in full later: the site’s total traffic kept falling right through the engagement. Branded search grew anyway, and the difference between those two lines is most of this story.
What we shipped, November to June
8 months of delivery, by service line:
| Service line | What shipped, November to June | Volume |
|---|---|---|
| AI Search Optimization | Prompt set defined, tracked monthly across four engines; entity and answer-accuracy fixes | 50 prompts, monthly |
| SEO & Content | A deliberately small set of bottom-of-funnel pages (alternatives, best-X-for-Y, top tools), plus offsite mentions and links building the domain’s authority | ~25 decision-stage pages built or rebuilt, blog posts plus a dedicated comparisons section, mapped to the 50 prompts; 154 existing pages refreshed; first-page positions held through the window |
| Review Management | Review campaign run through the client’s existing G2 partnership, timed with the customer success team, briefed for feature-specific reviews | 22 new reviews; velocity 1.5 to 2.75 a month; rating 4.6 to 4.7 |
| Digital PR | Niche placements in publications with real topical authority and real traffic in the category | ~365 net new linking sites (roughly 2,300 to 2,665); authority rating 68 |
One principle shaped all of it: AI engines don’t take a vendor’s word for gospel. They tend to use third-party sites instead, especially for bottom-of-funnel queries, and that’s just how the game works. So while most of the budget went into the client’s own site, a deliberate share went into the places the LLMs were retrieving from.
Inside one line: how the review work ran
The starting point deserves a disclosure, because it matters: the company had just wrapped a G2 review push before we arrived, so they didn’t come to us with an empty profile. What they came with was inconsistency. Outside that one burst, reviews had trickled in all year at roughly 1.5 a month, landing whenever a customer happened to feel like writing one.
We put the effort into G2 for one reason. Of the review platforms in this category, it was the one appearing most often in the brand’s AI mentions, and the engines were quoting it. That’s where we knew the evidence would compound and bring the most ROI.
The campaign was planned rather than blasted. We tend to time review invitations to the high points in the customer journey, so we worked closely with the customer success team to find where those sit. And since the client already had a partnership with G2, rather than bolting on a third-party tool we ran the invitations through it, landing at the right moments.
The briefing asked customers for one thing: name the specific features you use and the problem they solve for you. A review that says “great product” is a rating and nothing more. A review that names a feature and a solved problem is a sentence an engine can quote and attribute, and those are the reviews AI reaches for when a buyer asks about that exact job.
8 months later: 22 new reviews, and the rating up from 4.6 to 4.7.
Inside the content line: fewer pages, heavier pages
The content plan will look thin next to what most agencies ship, and that’s deliberate. We agreed it with the client early: the site already carried a large volume of content, most of it informational keyword and prompt volume, so this line’s job wasn’t more pages. It was tailoring the pages they had, strengthening them with data, and pointing a small set of new builds at the money.
The new builds were bottom-of-funnel pages mapped to the 50 prompts: alternatives pages, best-provider roundups for specific company types, top-tools comparisons for specific jobs, and reasons-to-choose pieces. Behind them ran the steady refresh programme, 154 existing pages updated across the window, because a fresh page is what sends the LLMs back out to retrieve it again, and from there the job is to keep building on what the engines re-read. Every one of those pages exists because a buyer with budget asks that exact question in the last weeks before a decision.
Those page types aren’t a stylistic preference. When someone asks an engine for the best option for their situation, the pages that get consulted and quoted are comparisons and roundups, and if the only comparison of you was written by a competitor, that’s the version AI repeats.
The bigger share of the line’s effort went off the website entirely: brand mentions on third-party sites, and links back to the domain, for two reasons. Authority is the tiebreaker on comparison queries, on Google and in AI answers alike. And mentions now count as a brand signal even without a link, which the old playbook never valued and never accounted for.
The linking side of that work is measurable. The number of sites linking to them grew from roughly 2,300 in November to 2,665 by the end of June, about 365 net new linking sites across the engagement, and the domain’s authority rating stands at 68.
Inside the PR line: topical authority beats a big DA number
We didn’t chase household-name publications. We targeted niche placements inside the industry this client sells into, and we picked them on a rule most link builders ignore: topical authority over generic domain authority.
A site can carry a domain authority of 80 and mean nothing for your category. Big general SaaS publications rank for everything and stand for nothing in a hyper-niche; a focused industry site with a fraction of the DA can be the source engines and buyers treat as the expert. And a high DA with no traffic is close to pointless, so every target had to clear two bars at once: authority in this specific subject, and real traffic, because a site can hold authority in the exact subject and still have nobody visiting it.
That filter is slower than buying links off a DA spreadsheet. It’s also why the citations that came back landed where buyers and engines look for this category, and it’s a large part of how the linking-site growth above turned into authority the engines respect rather than a vanity metric.
How we measured the AI search revenue
Every number on this page comes from one of 3 places: what buyers typed on the demo form, public tools anyone can check, or the client’s own records. Traffic isn’t one of them. Clicks were never the assignment.
| Metric | Source | How it’s measured |
|---|---|---|
| $1.1M ARR | Client CRM, founder-confirmed | Closed-won revenue in the window, assigned under the attribution model below |
| +86% qualified pipeline | Client CRM | Qualified opportunities vs the months before the engagement |
| +63% demos booked | Demo form data | Bookings vs the same pre-engagement period, with self-reported source captured on every entry |
| +45% AI share of voice | Our prompt tracking | Share of answers recommending the brand across the 50-prompt set, month over month |
The clearest signal came from the buyers themselves. The demo form asks every one of them the same question:

A growing share of the answers named ChatGPT. Buyers telling us where they found the company, in their own words, unprompted.
We could watch the same thing happen in the analytics. Click a link inside a ChatGPT or Perplexity answer and the session lands on the site with the engine as its referrer. We saw those sessions arrive in GA4 and turn into bookings, the same story from both directions.
One scope note before anyone asks: everything in these numbers is organic. There’s no paid search, no ads, no sponsored anything inside the $1.1M. The split we track runs between AI search, organic search, and the deals we can’t cleanly place.
Worth being precise about the words in the title, too. The revenue came from organic and AI search together, and the chart below splits it by last touch, the strictest reading there is. Last touch under-credits AI by design: a buyer who reads a ChatGPT answer and then Googles the company by name lands in the organic column of that chart. Most of what an AI answer does never shows up as a click from ChatGPT.
AI referrals made up 4.2% of organic sessions across the window. Those visitors booked 14.6% of the demos, a booking rate 3.9 times the one for organic search visitors, and once they were on a call they closed at a higher rate than the rest of the pool. Stack that together and a channel that small ends up holding 23% of the revenue in the chart below, about $250K of the $1.1M. The share grows at every step down the funnel, which is what later-stage buyers look like in a spreadsheet.
| Metric | Google organic, overall | AI search referral (AEO/GEO) | Impact ratio |
|---|---|---|---|
| Share of organic sessions | 95.8% | 4.2% | a small share of the visits, for now |
| Share of demos booked | 85.4% | 14.6% | books at 3.9x the rate |
| Share of closed-won revenue | 62% | 23% | 5.5x its traffic share |
| Revenue per demo, indexed | 1.0x | 1.6x | 1.6x more revenue per demo |
Deals we couldn’t cleanly assign went into an unattributed bucket, and we report the bucket rather than folding it into the wins.
Where the $1.1M landed
Closed-won ARR, November to June, by attributed source
The AI segment counts only the buyers we could prove: the ones who named an engine on the form, or arrived from one in the analytics. That makes 23% the minimum, and we’d rather publish a minimum than an estimate.
One more comparison worth making. The AI referrals arrive overwhelmingly on the same decision-stage pages the engines quote in their answers, so the closest like-for-like inside this funnel is those BOFU pages against the AI channel itself:
| Metric | Google organic, BOFU pages | AI search referral (AEO/GEO) | Impact ratio |
|---|---|---|---|
| Share of organic sessions | 6.2% | 4.2% | the new channel closing in on the old one’s footprint |
| Share of demos booked | 29.8% | 14.6% | the two highest-intent slices on the site |
| Share of closed-won revenue | 26.7% | 23% | together: a tenth of the sessions, about half the revenue |
| Revenue per demo (site average = 1.0x) | 0.9x | 1.6x | AI demos are worth 1.6x the site average |
On the 0.9x: the site average is pulled up by branded demos, the buyers who search the company by name and arrive already sold. The thing with AI search is that not every conversation is completely traceable. Some of those branded searches come after a conversation someone had with an LLM, so the demo gets counted as branded even though the AI answer did the work. That’s also part of why the AI column reads as a minimum.
A 30-minute call where we map what AI says about you and build a tailored roadmap.
The part most case studies hide
Total organic traffic fell during the engagement, and it fell hard. We’re telling you, because most case studies would leave this paragraph out. The decline was inherited: the search presence had been built almost entirely on top-of-funnel informational content, the exact category AI Overviews now answers without sending a click. When those answers arrived, that traffic went with them.
The part that matters: while the traffic line fell, revenue from organic rose by $1.1M. That gap between what the dashboard shows and what the pipeline shows is the whole argument of this page.
The fall had a specific shape. 82.9% of the site’s ranked keywords were informational, and that’s the exact category AI Overviews now answers in place. The site even ranked for “what is a web browser”, a query with 40,500 monthly searches and zero people in it who are buying the product. When the AI answers took queries like that, the clicks left and the revenue didn’t notice.
We say this to clients in week one and we’ll say it here: the traffic you’re losing to AI answers was mostly never going to buy anything. The question that matters is whether you show up where the buying questions get answered.
What grew while traffic fell: pipeline, demos, brand demand
3 things moved the right way. Rankings on the 50 prompts held first-page positions through the engagement. Branded search grew while overall traffic fell, which is what demand looks like when buyers arrive already knowing your name. That branded demand is also where a lot of AI influence lands: it climbed over the same months the brand climbed in AI answers, and those buyers show up in the organic column of the split above. And the brand now appears 223 times across the AI engines we track through third-party data, with 908 pages citing it in AI answers.
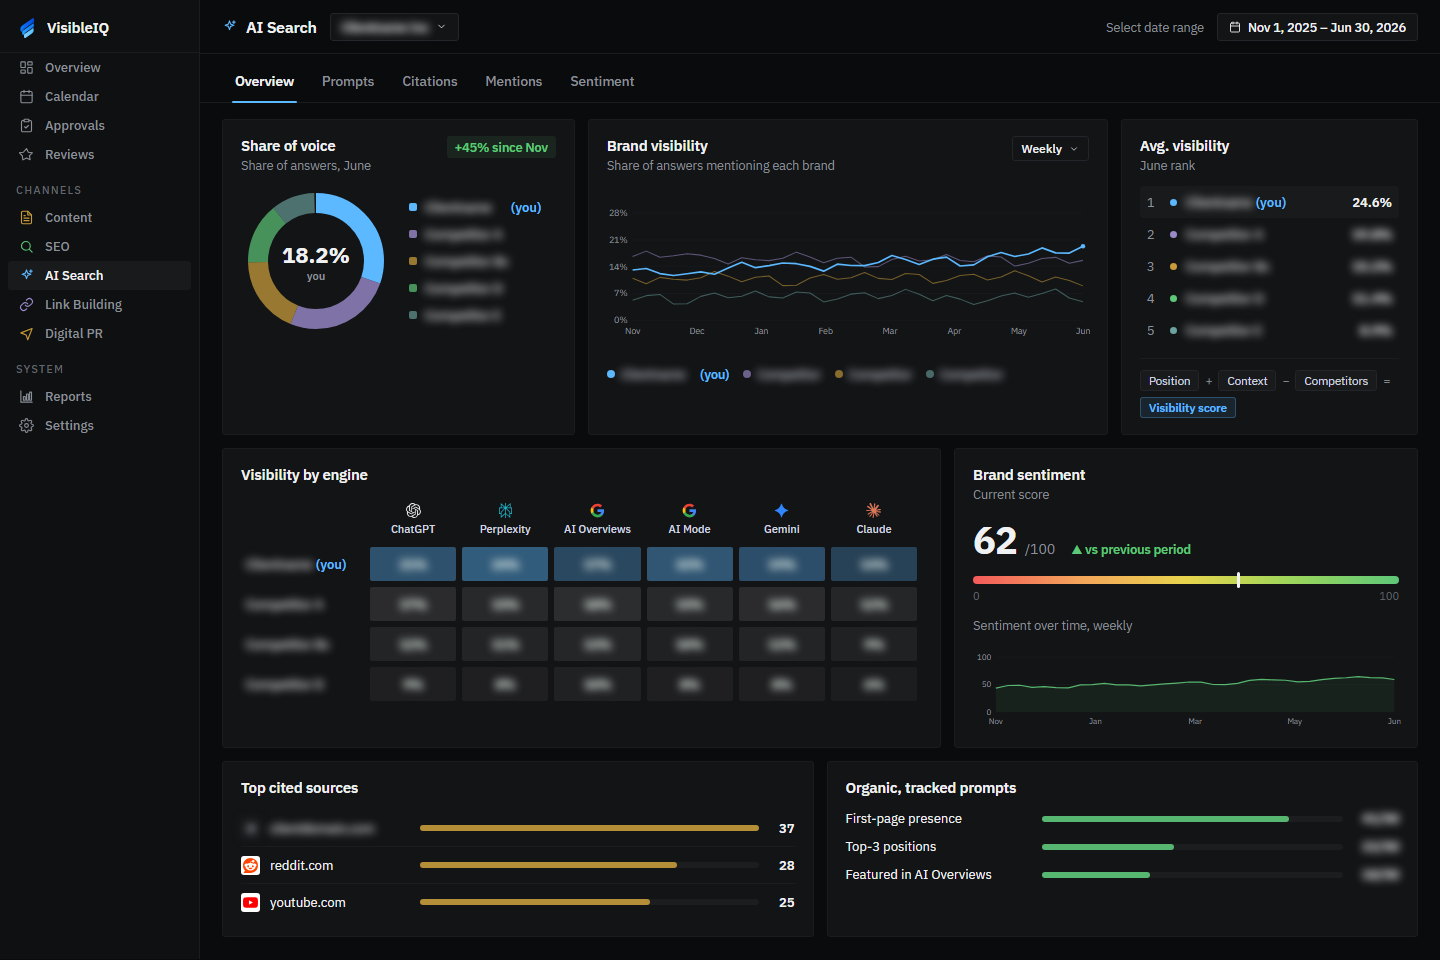
2 things in the dashboard’s citations panel deserve your attention. The client’s own site leading it means the content work gave engines something quotable. And community and video platforms sit in the top three, which tells you where this category’s AI answers get their evidence. Nobody was working those channels here, since social marketing sat outside this engagement’s scope, and they show up as top sources anyway. That’s the next lever, and it’s on the client’s roadmap.
The clearest of the three is branded search demand: the number of people typing the company’s name into Google each month. It went from roughly 2,500 searches in November to 3,200 by June, up 28% over the same months total traffic fell. Nobody searches a brand name by accident. That demand gets manufactured upstream, where a buyer meets the name in an AI answer, a G2 page or a comparison piece, and arrives at Google already pointed at it.
The review work, the linking sites and the branded demand all feed the same machine: more places for an engine to meet the brand, more reasons to trust it when it does, more buyers arriving with the name already in hand.
And the engagement as a whole, in the numbers that matter:
| Result | 8 months, November to June |
|---|---|
| New ARR from organic and AI search | $1.1M |
| Of that, attributed to AI search | 23%, about $250K |
| Qualified pipeline | +86% |
| Demos booked | +63% |
| AI share of voice across the 50 prompts | +45% |
| Demo booking rate, AI visitors vs organic search visitors | 3.9 times higher |
The work described here sits within our AI Search Optimization service. To assess your own starting point, use the AI visibility audit walkthrough.
What does ChatGPT tell buyers about you?
That’s the question this whole engagement grew out of, and it’s worth asking about your own company. If you don’t know the answer, you’re where this client was last November: rankings tracked, sessions tracked, and no view of the channel where the comparing happens. Falling clicks, a keyword profile heavy on informational queries, and answers being written about your category either way.
Their answer to that question was worth $1.1M in 8 months, while their traffic fell. My take is that most B2B SaaS teams are closer to that November than they think. The traffic they’re defending was mostly never going to buy, and the answers they’re not watching are already deciding shortlists. Work on the shortlist.
